Modern executives expect location data to inform every strategic decision—from pinpointing new store sites to monitoring field operations in real time.
Leaflet, the lightweight JavaScript mapping library, paired with the leaflet R package, delivers a fast, cost‑effective way to embed interactive maps in internal dashboards and public‑facing apps without locking your team into a costly GIS license.
Front Analytics can turn your complex data challenges into clear, actionable strategies. Learn more about our consulting services today.
Why Leaflet Matters for Business
-
Customer Insights
Visualize customer addresses, segment heat maps, and drive‑time polygons to target marketing spend where it matters most. -
Asset Management
Overlay live IoT sensor feeds or maintenance tickets on a map so operations managers can dispatch crews efficiently. -
Regulatory Compliance
Display boundaries for environmental zones, tax incentives, or franchise agreements to ensure every project stays inside approved areas. -
Stakeholder Engagement
Publish clear, shareable maps that help non‑technical audiences grasp complex spatial data at a glance.
Building a Business Map in R
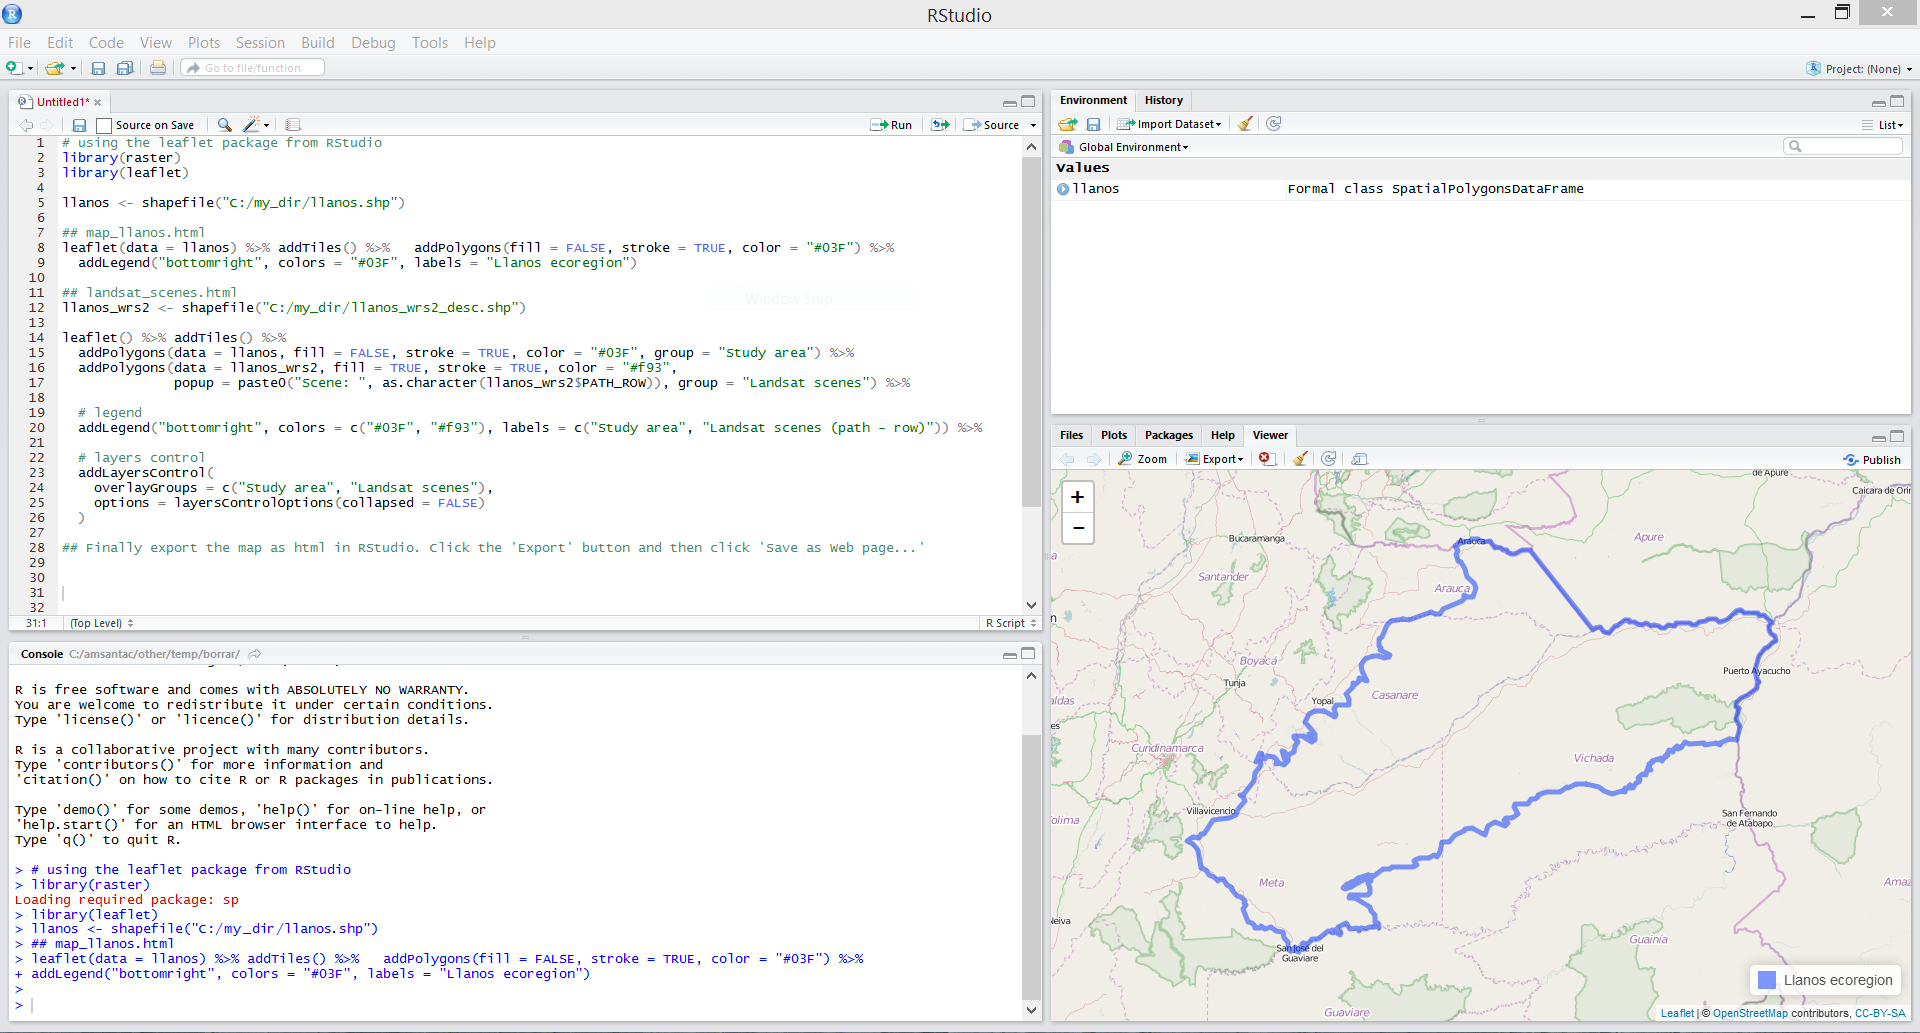
The leaflet package lets analysts stay in R—where the data already lives—yet deploy production‑grade web maps. A typical workflow:
-
Ingest Spatial Layers
Import corporate shape files or GeoJSON withsf,raster, orterra. -
Create a Map Widget
leaflet(data = my_layer)initializes the map, whileaddProviderTiles(providers$OpenStreetMap)supplies a free basemap. Swap in Mapbox or HERE tiles if your brand or SLA requires it. -
Style and Classify
Color code polygons by KPIs—sales volume, uptime, risk score—withaddPolygons()arguments forfillColor,weight, andopacity. -
Add Pop‑ups and Tooltips
popup = paste0("Revenue: $", my_layer$revenue)connects each geography to its key performance data so leaders drill into metrics on click. -
Layer Controls and Legends
addLayersControl()lets users toggle between business lines (e.g., retail vs. wholesale) while a legend clarifies symbols without forcing a separate PDF. -
Export and Embed
Save the widget as an HTML file from the RStudio Viewer or withhtmlwidgets::saveWidget(), then embed it in SharePoint, Tableau, or any CMS via an<iframe>.
Real‑World Use Cases
-
Retail Site Planning
Overlay demographic layers, competitor footprints, and drive‑time buffers to rank prospective locations. -
Supply‑Chain Visibility
Combine GPS pings and warehouse polygons so logistics teams reroute freight when bottlenecks appear. -
Utility Outage Dashboards
Display real‑time feeder status and crew positions, offering regulators transparent service‑level reporting. -
Insurance Risk Mapping
Relate claims history, flood plains, and wildfire boundaries to update underwriting models geographically. -
Agricultural Monitoring
Blend satellite‑derived crop health indices with field boundaries and weather forecasts for optimized input allocation.
Alternate Technology Options
-
JavaScript‑centric single‑page apps
Use Mapbox GL JS or ArcGIS API for JS when you need vector‑tile styling, 3D capabilities, or advanced enterprise GIS integration. -
Python data‑science pipelines
Use Folium or ipyleaflet when analysts work primarily in Jupyter notebooks. -
BI platform reporting
Use Power BI Map Visuals or Tableau Mapbox integration when your organization standardizes on BI suites for executive dashboards. -
Massive data volumes
Use deck.gl or Kepler.gl when you need GPU‑accelerated rendering for millions of points. -
No‑code enterprise mapping
Use ArcGIS Online or Google Maps Enterprise when you require turnkey hosting, SLAs, and out‑of‑the‑box geocoding services.
Deployment Best Practices
- Data Governance: Host authoritative layers in a cloud database (PostGIS, Snowflake, BigQuery GIS) and query them on demand.
- Performance: Simplify geometries or tile large rasters to keep load times under two seconds.
- Security: Serve maps over HTTPS and lock sensitive endpoints behind SSO; Leaflet widgets respect standard web security models.
- Branding: Use custom basemap styles or corporate fonts via Mapbox Studio or CartoCSS to maintain visual identity.
- Monitoring: Log tile requests and user interactions for analytics on map usage and infrastructure costs.
Key Takeaway
Leaflet combined with the leaflet R package gives business teams a flexible, open‑source path to transform raw spatial data into interactive decision tools—without sacrificing brand polish or enterprise‑grade performance.
Whether you’re optimizing routes, prioritizing capital projects, or communicating risk to leadership, a Leaflet map can put the “where” into every “why” your data analysts uncover.